
(Financial Year 2023–24) in $
| Rank | Country | Exports | Imports | Total Trade | Trade Balance |
|---|---|---|---|---|---|
| - |  European Union European Union |
75.93 | 59.38 | 135.31 | 16.55 |
| - |  ASEAN ASEAN |
41.21 | 79.67 | 120.88 | -38.46 |
| 1 |  China China |
16.66 | 101.75 | 118.41 | -85.09 |
| 2 |  United States United States |
77.52 | 40.77 | 118.29 | 36.74 |
| 3 |  United Arab Emirates United Arab Emirates |
35.63 | 48.02 | 83.65 | -12.39 |
| 4 |  Russia Russia |
4.26 | 61.43 | 65.69 | -57.17 |
| 5 |  Saudi Arabia Saudi Arabia |
11.56 | 31.81 | 43.37 | -20.25 |
| 6 |  Singapore Singapore |
14.41 | 21.2 | 35.61 | -6.79 |
| 7 |  Iraq Iraq |
3.35 | 30 | 33.35 | -26.65 |
| 8 |  Indonesia Indonesia |
5.99 | 23.41 | 29.4 | -17.42 |
| 9 |  Hong Kong Hong Kong |
8.24 | 20.45 | 28.69 | -12.21 |
| 10 |  South Korea South Korea |
6.42 | 21.14 | 27.56 | -14.72 |
| 11 |  Netherlands Netherlands |
22.37 | 4.97 | 27.34 | -17.4 |
| 12 |  Germany Germany |
9.84 | 16.27 | 26.11 | -6.43 |
| 13 |  Australia Australia |
7.94 | 16.16 | 24.1 | -8.22 |
| 14 |  Japan Japan |
5.16 | 17.7 | 22.86 | -12.54 |
| 15 |  Switzerland Switzerland |
1.53 | 21.24 | 22.77 | -19.71 |
| 16 |  United Kingdom United Kingdom |
12.92 | 8.42 | 21.34 | 4.5 |
| 17 |  Malaysia Malaysia |
7.26 | 12.75 | 20.01 | -5.49 |
| 18 |  South Africa South Africa |
8.71 | 10.54 | 19.25 | -1.83 |
| 19 |  Belgium Belgium |
7.84 | 7.24 | 15.08 | 0.6 |
| 20 |  Thailand Thailand |
5.04 | 9.91 | 14.95 | -4.87 |
| 21 |  Vietnam Vietnam |
5.47 | 9.35 | 14.81 | -3.86 |
| 22 |  Italy Italy |
8.77 | 5.8 | 14.56 | 2.97 |
| 23 |  Qatar Qatar |
1.7 | 12.38 | 14.08/td> | -10.68 |
| 24 |  France France |
7.14 | 6.24 | 13.38 | 0.9 |
| 25 |  Bangladesh Bangladesh |
11.06 | 1.84 | 12.91 | 9.22 |
| - | Remaining Countries | 130.33 | 114.64 | 244.97 | 15.69 |
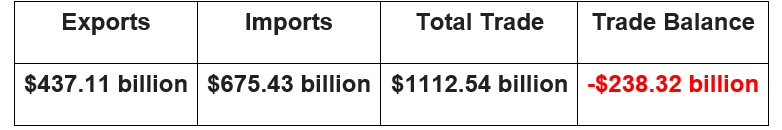
| India's Total | 130.33 | 675.43 | 1112.54 | -238.32 |
| Rank | Region | Percentage |
|---|---|---|
| 1 |  Bhutan Bhutan |
95.3% |
| 2 |  Guinea-Bissau Guinea-Bissau |
67.1% |
| 3 |  Afghanistan Afghanistan |
56.5% |
| 4 |  Nepal Nepal |
53.1% |
| 5 |  Nigeria Nigeria |
30.6% |
| 6 |  Mozambique Mozambique |
28.1% |
| 7 |  Ghana Ghana |
23.8% |
| 8 |  Tanzania Tanzania |
21.8% |
| 9 | Iraq |
21.2% |
| 10 |  United Arab Emirates United Arab Emirates |
10.1% |